
Software
ggbiplot
In an answer to a question posted on CrossValidated, I provided an example of a biplot using the R package ggplot2. I've gotten several inquiries about it, so I've decided to bundle it into an R package and to make it available on github: ggbiplot.
To install the package:
library(devtools)
install_github("ggbiplot", "vqv")
Here is an example:
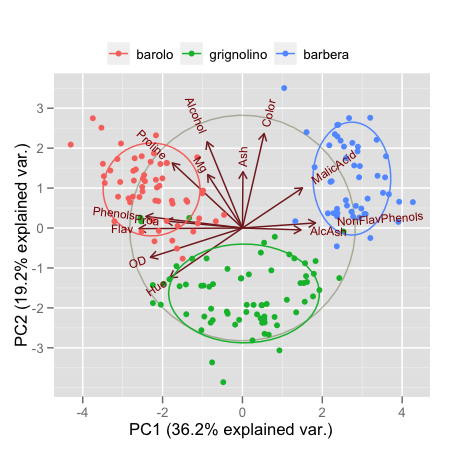
library(ggbiplot)
data(wine)
wine.pca <- prcomp(wine, scale. = TRUE)
g <- ggbiplot(wine.pca, obs.scale = 1, var.scale = 1,
              groups = wine.class, ellipse = TRUE, circle = TRUE)
g <- g + scale_color_discrete(name = '')
g <- g + opts(legend.direction = 'horizontal',
              legend.position = 'top')
print(g)